Image Details
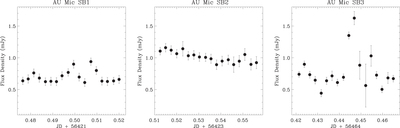
Caption: Figure 5.
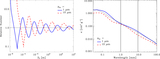
Stellar light curves for AU Mic showing the variation in flux density over the course of our three observations. The flux density was determined for each 3-minute integration using the CASA task uvmodelfit to fit a point-source model to the visibilities.
Other Images in This Article
Copyright and Terms & Conditions
© 2016. The American Astronomical Society. All rights reserved.
Copyright ©
2026 Astronomy Image Explorer. All Rights Reserved.