Image Details
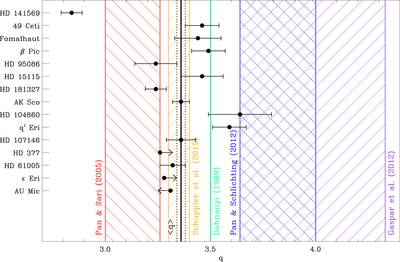
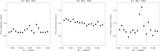
Caption: Figure 3.
Distribution of power-law index q values for the full sample of debris disks together with model predictions. Black data points indicate the values for the individual disks in the sample, with the weighted mean and uncertainty, ﹩q=3.36\pm 0.02﹩, shown by the solid and dotted black lines, respectively. Stars have been ordered by luminosity from top to bottom (see Table 1 for specific luminosity values). The solid lines and dashed regions indicate different model predictions: “rubble pile” planetesimals not dominated by material strength (Pan & Sari 2005; red), results of the ACE numerical model for AU Mic (Schüppler et al. 2015; orange), the classic Dohnanyi (1969) result (green), numerical results of Gáspár et al. (2012; purple), and incorporating a size-dependent velocity distribution (Pan & Schlichting 2012; blue).
Other Images in This Article
Copyright and Terms & Conditions
© 2016. The American Astronomical Society. All rights reserved.