Image Details
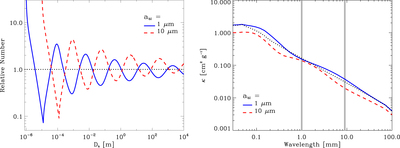
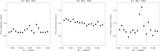
Caption: Figure 4.
Left: comparison of the relative size distribution, ﹩n{(a)/n(a)}_{\mathrm{pl}}﹩, for a steady-state collisional cascade with a blowout size ﹩{a}_{\mathrm{bl}}﹩ of 1 μm (blue solid line) and 10 μm (red dashed line). For both models, we have divided the analytic number distribution, n(a), by the expectation for a power-law distribution, ﹩n{(a)}_{\mathrm{pl}}\propto {a}^{-3.5}﹩, to show the waves introduced by the small-size cutoff more clearly. The expected power-law size distribution, ﹩n{(a)}_{\mathrm{pl}}﹩, is indicated by the dotted black line. For all models, we assume ﹩{Q}_{D}^{*}=6\times {10}^{3}﹩ J kg−1 and ﹩{v}_{\mathrm{rel}}=5﹩ km s−1. Right: resulting ensemble opacity as a function of wavelength for a 1 μm blowout size (blue solid line) and a 10 μm blowout size (red dashed line). Again, the dotted black line indicates the expected ensemble opacity for the power-law size distribution with no waves. The gray lines indicate the wavelengths of our (sub)millimeter and VLA observations used to determine the millimeter spectral index, ﹩{\alpha }_{\mathrm{mm}}﹩.
Other Images in This Article
Copyright and Terms & Conditions
© 2016. The American Astronomical Society. All rights reserved.