Image Details
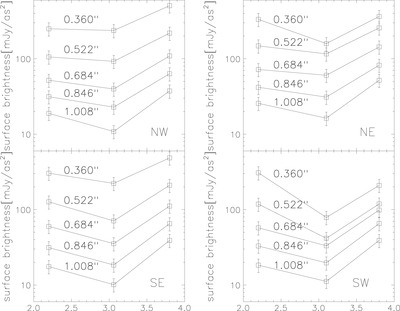
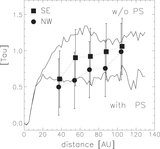
Caption: Figure 3.
Extracted spectra along the major (SE-NW) and minor (SW-NE) axes at positions of 0.″360, 0.″522, 0.″684, 0.″846, and 1.″008 from the central star shown in Figure 2. The size of each extracted area is a square region with 0.″162 (9 pixels) on the side. In the spectra of almost all of the regions, a shallow dip at 3.06 μm is seen, likely due to water ice absorption.
Other Images in This Article
Copyright and Terms & Conditions
© 2016. The American Astronomical Society. All rights reserved.
Copyright ©
2026 Astronomy Image Explorer. All Rights Reserved.