Image Details
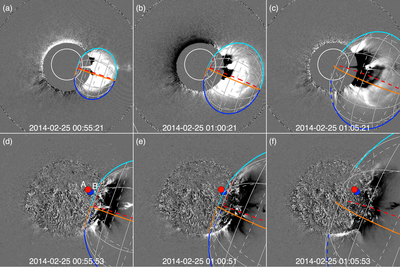
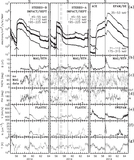
Caption: Figure 5.
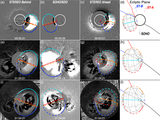
(Top) STEREO-B/SECCHI/COR-1 and (Bottom) STEREO-B/SECCHI/EUVI 195 Å difference images obtained by subtracting the image taken 5 minutes earlier from the image taken at the indicated times. Overplotted is the position of the ellipsoid obtained by the model of Kwon et al. (2014) that best describes the 3D structure of the front shock ahead of the CME. Red, orange, blue and cyan colors represent each quadrant of the ellipsoid, whereas white circles are used to indicate the surface of the ellipsoid (dashed lines are used when the reconstructed structure is on the other side of the plane of the image). In the bottom panels, the blue and red symbols identify the footpoints of the magnetic field lines connecting to STEREO-B and STEREO-A using either the MAS or the PFSS models, respectively (the size used for the symbol covers the locations of the footpoints estimated using both models). For the image at 01:05 (right panels) the EUV wave was not observed anymore and the ellipsoid was obtained by just fitting the white-light coronagraph images.
Other Images in This Article
Show More
Copyright and Terms & Conditions
© 2016. The American Astronomical Society. All rights reserved.