Image Details
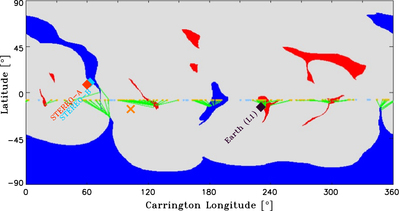
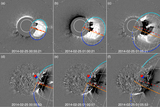
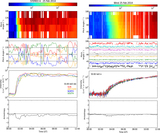
Caption: Figure 3.
Coronal holes computed from the MAS simulation color-coded according to the observed underlying photospheric magnetic field (red for outward and blue for inward magnetic field polarity). Earth’s trajectory is superimposed (thin orange dots), together with the mapped source regions of the plasma measured at ACE (indicated by the green lines). Earth was at Carrington Longitude 185° at 00:39 UT on 2104 February 25. The black diamond identifies the footpoint of the magnetic field line connecting to ACE at that time. We have also indicated with cyan and red diamonds the location of the footpoints of the field lines connecting to STEREO-B and STEREO-A, respectively. The orange cross identifies the site of the parent flare.
Other Images in This Article
Show More
Copyright and Terms & Conditions
© 2016. The American Astronomical Society. All rights reserved.