Image Details
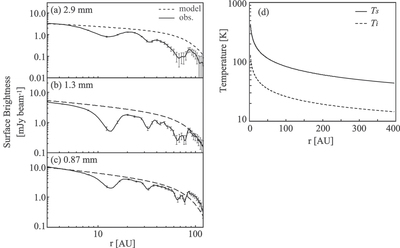
Caption: Figure 4.
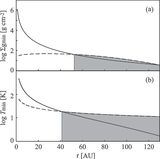
Panels (a)–(c) show surface brightness profiles (see the solid curve) at 2.9, 1.3, and 0.87 mm in wavelengths along the semimajor axis (PA = 138°), respectively. The dashed curve represents the profile generated by the Kwon et al. (2011) model. The error bar represents 5σ and the horizontal line at the lower left corner indicates the beam size at each wavelength. Panel (d) represents the radial temperature distributions at the disk surface (solid curve) and the mid-plane (dashed curve) of the disk computed from the Kwon et al. (2011) model.
Other Images in This Article
Copyright and Terms & Conditions
© 2016. The American Astronomical Society. All rights reserved.
Copyright ©
2026 Astronomy Image Explorer. All Rights Reserved.