Image Details
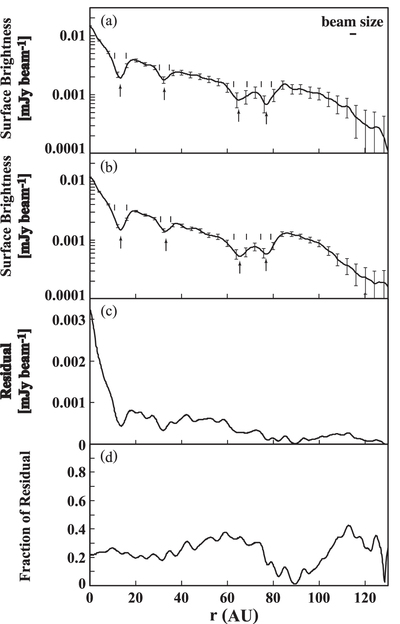
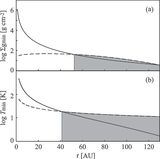
Caption: Figure 3.
Panels (a) and (b) are the surface brightness profiles generated from our reprocessed image (Figure 2(a)) and the ALMA science verification archive data (Figure 2(b)) along the semimajor axis (PA = 138°), respectively. The error bars show 5σ. Note that the systematic error in the absolute flux determination is expected to be approximately 10% at most (see ALMA Proposers Guide and Capabilities). The beam size is shown in the upper right corner of the panel (a) as a reference. The arrows indicate the location of each gap and the pairs of the vertical solid lines describe the width at each gap. Panel (c) indicates the residual that is computed by subtracting (b) from (a), and the panel (d) represents the fraction of residuals with respect to (a).
Other Images in This Article
Copyright and Terms & Conditions
© 2016. The American Astronomical Society. All rights reserved.