Image Details
Caption: Figure 1.
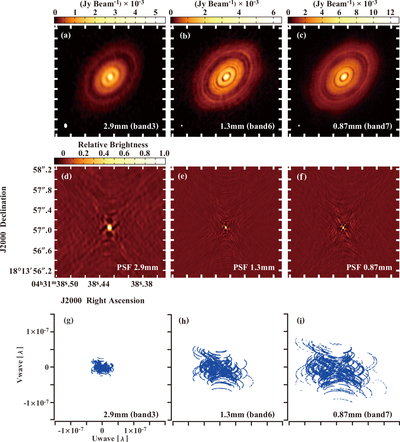
Dust continuum emission maps of HL Tau at 2.9 mm (a), 1.3 mm (b), and 0.87 mm (c) are provided with corresponding images of their synthesized beam maps (psf) and uv-coverages. The beam size at each wavelength is provided as a white filled ellipse in the lower left corner in the top panels.
Other Images in This Article
Copyright and Terms & Conditions
© 2016. The American Astronomical Society. All rights reserved.
Copyright ©
2026 Astronomy Image Explorer. All Rights Reserved.