

Image Details
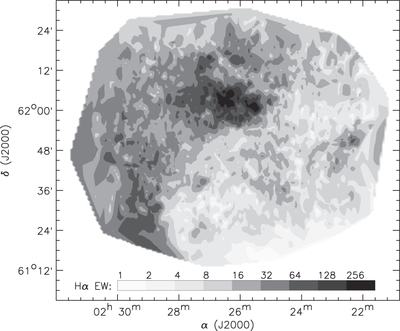
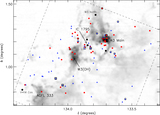
Caption: Figure 6.
Map of Hα emission across W3 measured from 6083 Hectospec sky spectra (270 lpm). The bright central region is IC 1795; the left edge of the image is part of the W4 H II region. The equivalent widths have an average uncertainty of ±1 Å.
Other Images in This Article
Show More
Copyright and Terms & Conditions
© 2015. The American Astronomical Society. All rights reserved.

Copyright ©
2026 Astronomy Image Explorer. All Rights Reserved.
