

Image Details
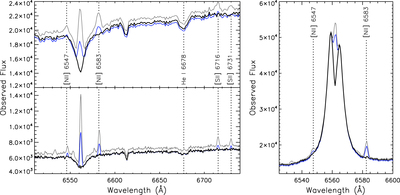
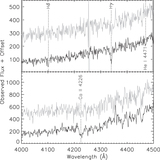
Caption: Figure 4.
Left: spectra of an example B-type star (source 15 in Table 2), comparing the result of no sky subtraction (gray), subtraction of a master sky spectrum (blue), and sky subtraction via the method described in Section 2.3 (thick black spectrum). The top spectrum was taken with Hectospec’s 270 lines mm−1 (lpm) grating; the bottom spectrum is the same object observed with the 600 lpm grating. Nebular emission lines (except for Hα) and relevant spectral features are labeled. Right: same as left for a source with intrinsic Hα emission (source 65 in Table 2).
Other Images in This Article
Show More
Copyright and Terms & Conditions
© 2015. The American Astronomical Society. All rights reserved.

Copyright ©
2026 Astronomy Image Explorer. All Rights Reserved.
