Image Details
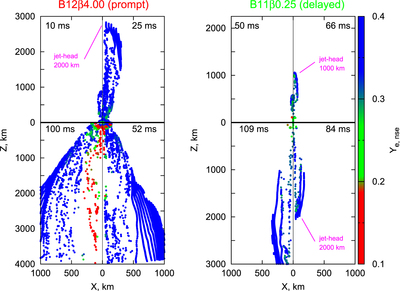
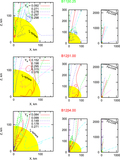
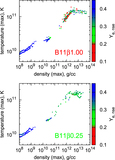
Caption: Figure 4.
Dynamics of explosion models expressed by tracer particles for B12 ﹩\beta ﹩ 4.00 (left) and B11 ﹩\beta ﹩ 0.25 (right). The distribution of particles is shown in a quarter of each panel at the moment the jet-head reaches 1000, 2000, 3000, and 4000 km, respectively. Corresponding times after the bounce are shown in each panel: 10, 25, 52, and 100 ms for prompt-jets and 50, 66, 84, and 109 ms for delayed-jets, respectively. The color scale indicates ﹩{Y}_{{\rm{e}},\mathrm{nse}}﹩, ﹩{Y}_{{\rm{e}}}﹩ at the end of NSE.
Other Images in This Article
Show More
Copyright and Terms & Conditions
© 2015. The American Astronomical Society. All rights reserved.
Copyright ©
2026 Astronomy Image Explorer. All Rights Reserved.