Image Details
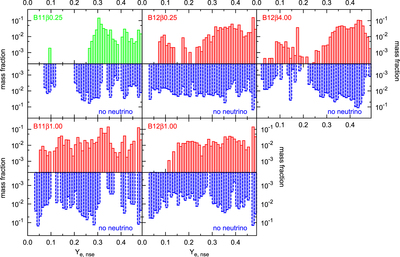
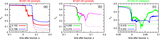
Caption: Figure 10.
Histogram of ﹩{Y}_{{\rm{e}},\mathrm{nse}}﹩ vs. the mass fraction of the total ejecta. Each plot corresponds to the explosion model whose name is in the upper left, where there are two different histograms, that is, the case includes neutrino absorptions (red bars) and ignores these effects (blue bars).
Other Images in This Article
Show More
Copyright and Terms & Conditions
© 2015. The American Astronomical Society. All rights reserved.
Copyright ©
2026 Astronomy Image Explorer. All Rights Reserved.