Image Details
Caption: Figure 7.
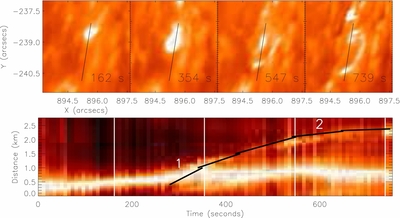
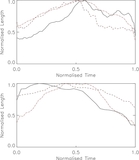
Evolution of the EB analyzed in Case Study II at +0.8 Å. In the top row, four frames from this wavelength are plotted starting at 7:40:49 UT and separated by 146.3 s. The initial EB event is easily observed in the left-hand frame. The most dynamic horizontal motion of the event is shown in the second frame before the generation of the apparent loop is depicted in the third and fourth frames. The bottom row shows the time-distance analysis of the black slit overlaid on the top row with intensity normalized through time to remove the influence of changes in seeing. The black line indicates the speed of the event through time, highlighting the evident deceleration. The speeds of the event at the times marked by 1 and 2 are 6.2 km s−1 and 0.6 km s−1, respectively. The white vertical lines depict the temporal position of each of the four top row plots.
Other Images in This Article
Copyright and Terms & Conditions
© 2015. The American Astronomical Society. All rights reserved.