Image Details
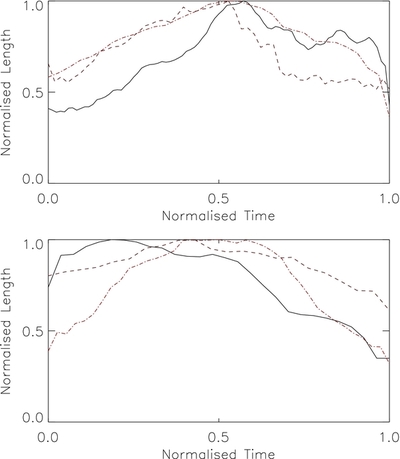
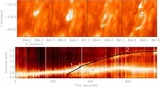
Caption: Figure 4.
Smoothed projection profiles for the tips (normalized against the peak length of each event) of the three EB segments analyzed in Case Study: I (top) and three other independent EBs (bottom). Each event is plotted through its full lifetime. The top panel highlights the parabolic evolutions of each small segment, indicative of a repetitive driver. These profiles are similar to the majority of EB events, represented by the dashed and dot–dashed lines in the bottom panel.
Other Images in This Article
Copyright and Terms & Conditions
© 2015. The American Astronomical Society. All rights reserved.
Copyright ©
2026 Astronomy Image Explorer. All Rights Reserved.