Image Details
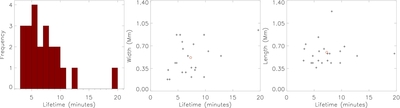
Caption: Figure 3.
Basic statistical properties of EBs. Left: lifetime of each of the 22 identified events, with all but three events existing for less than 10 minutes. Center: distribution of peak width vs. lifetime. Right: same as center but for length. The red circles indicate the mean of both variables for each plot.
Other Images in This Article
Copyright and Terms & Conditions
© 2015. The American Astronomical Society. All rights reserved.
Copyright ©
2026 Astronomy Image Explorer. All Rights Reserved.