Image Details
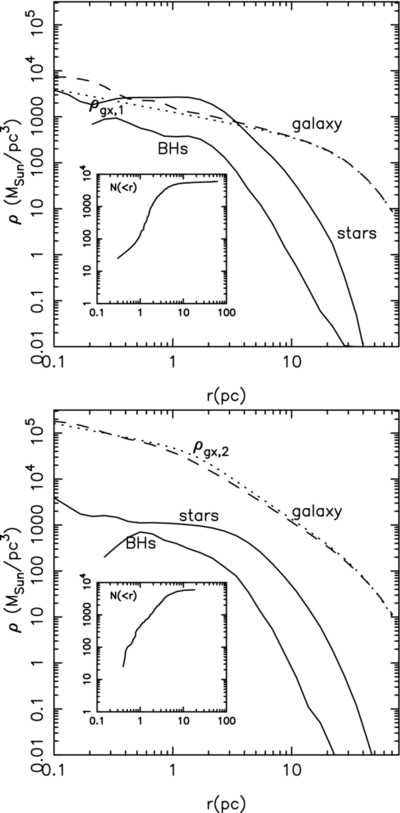
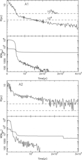
Caption: Figure 9.
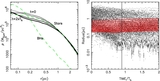
Density profile of BHs and stars at the end of the single inspiral simulations of Table 1. Upper panel corresponds to simulation A1 and lower panel to simulation A2. Density profiles are given after the BH cluster are artificially dispersed as described in the text. Insert panels show the corresponding cumulative number distributions of stellar BHs. Dotted curves give the density model of the initial galaxy models of Equations (9) and (10). The density profile of the galaxy at the end of the simulation is shown as dashed curves. Up to ~100 BHs are migrated inside the inner 0.1–0.2 pc of the galactic center.
Other Images in This Article
Show More
Copyright and Terms & Conditions
© 2014. The American Astronomical Society. All rights reserved.