Image Details
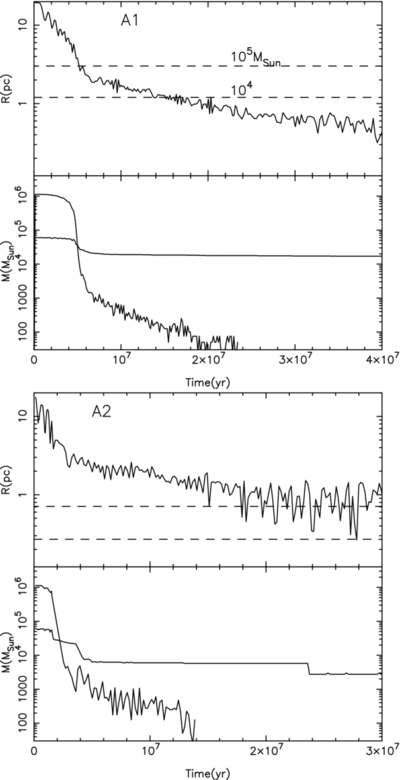
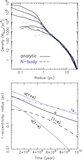
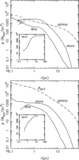
Caption: Figure 8.
Time evolution of galactocentric radius (upper panels) and bound mass (lower panels) of the globular cluster models in runs A1 and A2 (see Table 1). In the lower panels we show separately the bound mass in BHs (curve starting at 6 × 10⁴ M☉) and in stars (curve starting at 1.1 × 10⁶ M☉) Dashed curves in the upper panels give the galactocentric radii in the initial galaxy models containing 104 and 105 M☉.
Other Images in This Article
Show More
Copyright and Terms & Conditions
© 2014. The American Astronomical Society. All rights reserved.
Copyright ©
2026 Astronomy Image Explorer. All Rights Reserved.