Image Details
Caption: Figure 2.
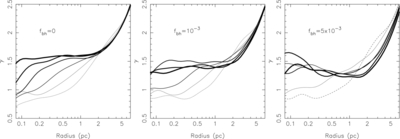
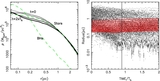
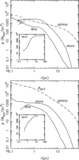
Evolution of the density slope, γ ≡ −dlog ρ/dlog r, of the main-sequence density profile in multi-mass N-body models (center and right panels) compared with a model with only one mass component (left panel). The continued curves show profiles at  ; increasing line width corresponds to increasing time. The dashed curve corresponds to the initial model. Adding a BH component accelerates the growth of a density cusp in the stellar component. However, the time to regrow a cusp in these models is always longer than
  , i.e., 5 Gyr when scaled to the Milky Way, a time longer than the mean stellar age of the Galactic NC.
Other Images in This Article
Show More
Copyright and Terms & Conditions
© 2014. The American Astronomical Society. All rights reserved.