Image Details
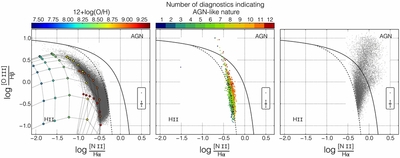
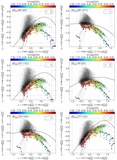
Caption: Figure 10.
Location of the H II-like (left), AGN-like (right), and uncertain (middle) SDSS galaxies in the standard log [N II]/Hα vs. log [O III]/Hβ diagram. Uncertain galaxies are color-coded as a function of how many diagnostics indicate a non-H II-like nature. The diagnostic lines from Kewley et al. (2001a) and Kauffmann et al. (2003a) are marked with full and dashed lines, respectively. The different sectors (H II, AGN) are labeled following the nomenclature defined in Figure 4 of Kewley et al. (2006). We also show the MAPPINGS IV model grid for κ = 20 in the left-hand diagram, where each grid point is color-coded as a function of 12 + log (O/H).
Other Images in This Article

Show More
Copyright and Terms & Conditions
© 2014. The American Astronomical Society. All rights reserved.