Image Details
Caption: Figure 1.
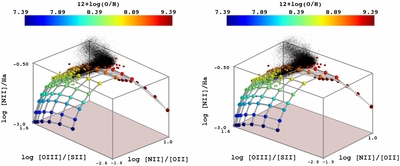
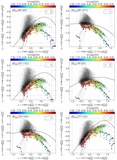
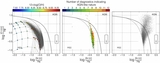
Example of a 3D line ratio diagram, labeled  (a.k.a. log [N II]/[O II] versus log [O III]/[S II] versus log [N II]/Hα), in the form of a cross-eyed stereo pair. The plane of MAPPINGS IV simulations of H II regions is represented by the colored spheres connected by the gray rods, where each sphere corresponds to one distinct simulation. The color indicates the oxygen abundance in terms of 12 + log (O/H). Individual cubes correspond to the van Zee et al. (1998) data points, and the small cones to the NCG 5472 measurements of individual H II regions, also colored as a function of their metallicity. Detailed instructions to view this cross-eyed stereo pair can be found in Vogt & Wagner (2012). An .HTML file containing an interactive version of this Figure is available as supplementary material, and can also be directly accessed online (http://dx.doi.org/10.1088/0004-637X/793/2/127/data).
(A color version and supplemental data of this figure are available in the online journal.)
Other Images in This Article
Show More
Copyright and Terms & Conditions
© 2014. The American Astronomical Society. All rights reserved.