Image Details
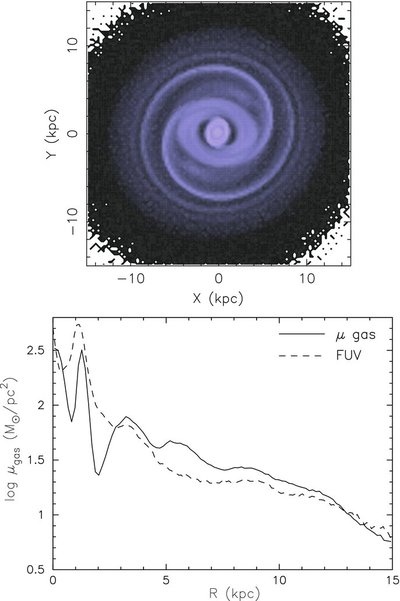
Caption: Figure 9.
Left panel: snapshot of the SPH simulation showing the spiral arms as a response to the inner oval distortion. Right panel: the solid line shows the gas surface density profile of our model. The different peaks represent the response of the gas to the dynamical effect of the oval distortion. The dashed line shows the FUV surface brightness (i.e., a good proxy to the recent star formation) scaled to fit in the plot.
Other Images in This Article


Copyright and Terms & Conditions
© 2009. The American Astronomical Society. All rights reserved.
Copyright ©
2026 Astronomy Image Explorer. All Rights Reserved.