Image Details
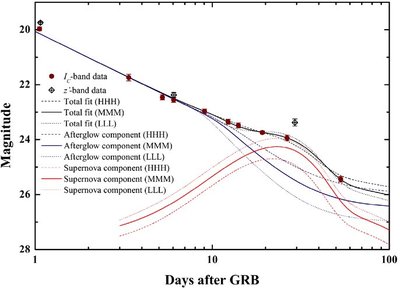
Caption: Figure 6.
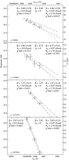
Fits to the late-time I C -band data with a combination of an afterglow component described with a broken power law, a constant host-galaxy component, and a supernova component. We assume that the late afterglow, in terms of break-time (11.5 ± 3 day) and post-break decay slope (2.45 ± 0.35), follows the values derived from the X-ray afterglow (the pre-break decay slope is left free to vary, but is strongly constrained by earlier data which is not plotted). The black lines represent the sum of all components, directly fitted to the data. The blue lines give the afterglow plus host-galaxy component, whereas the red lines show the supernova contribution. The unbroken lines denote the use of the central values (M for Mid) derived from the X-ray fit and a host-galaxy magnitude of I C = 26.5. The dotted lines denote the extreme (L)ow case of the (within 1σ errors of the X-ray fit) earliest break and steepest post-break decay slope, as well as the faintest host galaxy (where we choose conservative errors of 0.5 mag). In this case, at late times, the supernova dominates the afterglow. The dashed lines denote the opposite case (H for High), a late break and shallow post-break decay as well as a bright host galaxy, which results in the smallest supernova contribution, comparable to the afterglow at peak. Even so, we find this "faint" supernova component to be 50% more luminous than SN 1998bw at peak. We also plot the three z′ observations. The two first points show no color evolution, whereas the last point is significantly brighter than the extrapolated I C light curve and gives further evidence of the strong reddening due to the rising supernova component.
Other Images in This Article
Copyright and Terms & Conditions
© 2009. The American Astronomical Society. All rights reserved.