Image Details
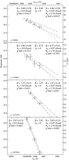
Caption: Figure 5.
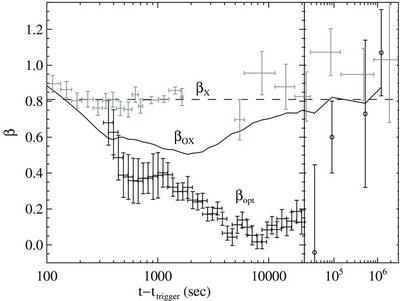
Evolution of the afterglow spectral index β with time. The optical spectral index β opt is measured from a fit to the UV-optical-IR data from each of 40 different overlapping bins ranging from 360 s to 22,000 s, plus one additional series of UVOT exposures and the first three multicolor Gemini epochs. The X-ray spectral index is also plotted (gray points), with the dashed line showing the best-fit value assuming no spectral evolution (which the data are consistent with). The optical-to-X-ray spectral index β OX is defined as the index between the X-ray (normalized at 1 keV) and the V-band optical flux. At early times the optical spectral index evolves from red to blue to red again. The X-ray, optical, and optical-to-X-ray spectral indices are all consistent at late times, which may suggest that both optical and X-ray bands are in the same synchrotron regime.
Other Images in This Article
Copyright and Terms & Conditions
© 2009. The American Astronomical Society. All rights reserved.