

Image Details
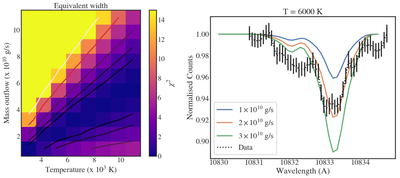
Caption: Figure 4.
Panels (a) and (b) illustrate the 1D Parker-wind model grid. (a) The color map shows the chi-square valley in the ﹩\dot{M}﹩-T space for the measured equivalent widths compared to the 1D model equivalent width. The contours of the valley are also overlaid on the image. (b) The colored curves show line profiles predicted for a 1D model at 6000 K for different mass-loss rates, compared to the three-pixel-smoothed observed average line profile (black dotted curve with error bars).
Other Images in This Article
Copyright and Terms & Conditions
© 2026. The Author(s). Published by the American Astronomical Society.

Copyright ©
2026 Astronomy Image Explorer. All Rights Reserved.
