

Image Details
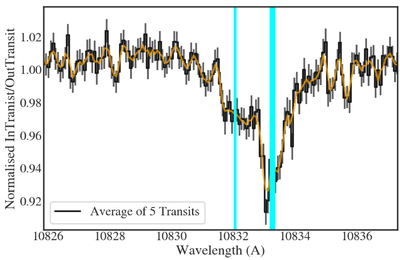
Caption: Figure 1.
This figure shows the average He I 10830 Å absorption profile from TOI-3884b during transit. The black curve is the weighted-average profile from all the five transit epochs. The orange curve is a three-pixel-smoothed version of the same profile. The vacuum rest wavelengths of the He I 10830 Å triplet lines are marked by the vertical cyan lines. The x-axis shows vacuum wavelength in the planet’s rest frame.
Other Images in This Article
Copyright and Terms & Conditions
© 2026. The Author(s). Published by the American Astronomical Society.

Copyright ©
2026 Astronomy Image Explorer. All Rights Reserved.
