

Image Details
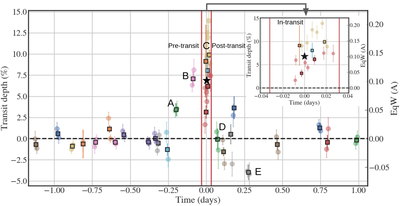
Caption: Figure 2.
This figure shows the evolution of the relative transit depth and equivalent width of the He I 10830 Å absorption in TOI-3884b across the pretransit (A) and (B), in-transit (C), and posttransit phases (D). The outlier E is explained in Section 3.6. The x-axis shows the orbital phase, centered on midtransit, in units of days. The left y-axis shows the transit depth in percent and the right y-axis shows the scaled equivalent width in Å. The circular points represent the transit depth measured for individual spectrum with S/N > 20. The square points represent the measured transit depth from the spectra averaged within each visit. Each color is an independent night of observation. The vertical red lines mark the duration of the planet’s transit. The inset shows a zoomed-in view of the phase range inside the transit window. The average in-transit signal is marked by a black star symbol in the inset. Since the spectra at each epoch were continuum normalized, the optical transit depth of planet is not shown here.
Other Images in This Article
Copyright and Terms & Conditions
© 2026. The Author(s). Published by the American Astronomical Society.

