

Image Details
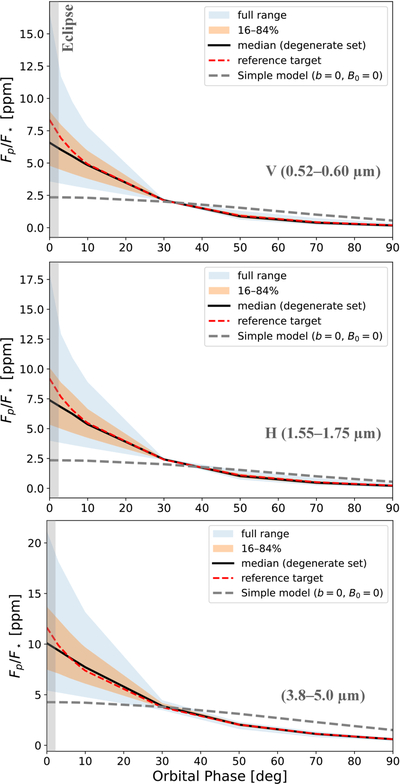
Caption: Figure 7.
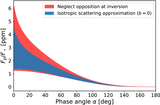
Band-integrated phase curves for three representative wavelength regimes: reflection-dominated (0.52–0.60 μm), mixed reflection-thermal (1.55–1.75 μm), and thermal-dominated (3.8–5.0 μm). The shaded regions indicate the range of disk-integrated phase curves predicted by photometric parameter sets consistent with the same single-geometry laboratory reflectance spectrum. The darker shaded region corresponds to the central 68% interval, while the lighter region shows the full extent of the solutions. The black solid line represents the median predicted phase curve, and the red dashed line corresponds to the reference laboratory reflectance behavior. The gray dashed line shows the prediction of a simplified photometric model assuming isotropic scattering (b = 0) and no opposition effects (B0 = 0), with the single-scattering albedo adjusted to reproduce the laboratory reflectance at the reference geometry. Although this simplified model matches the laboratory measurement by construction, it produces substantial systematic biases in the predicted reflected-light observables away from the measurement geometry.
Other Images in This Article
Copyright and Terms & Conditions
© 2026. The Author(s). Published by the American Astronomical Society.

