

Image Details
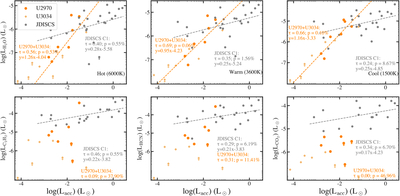
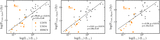
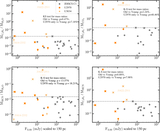
Caption: Figure 6.
Comparison of molecular line luminosities and accretion luminosity. The water line luminosities are based on the hot, warm, and cool single lines defined in A. Banzatti et al. (2025), while the C-bearing molecules are from the best-fit model within 12−16 μm following N. Arulanantham et al. (2025) and E. Raul et al. (2026). The Kendall τ and p-values are listed. The fitted correlation is overplotted if the correlation is significant with p ≲ 5%. For young-disk sample, the correlations are similar for each molecule. For the older USco sample, the correlations between water lines and ﹩\mathrm{log}﹩Lacc are stronger, while no correlation is found between C-bearing molecular luminosity and ﹩\mathrm{log}﹩Lacc.
Other Images in This Article
Show More
Copyright and Terms & Conditions
© 2026. The Author(s). Published by the American Astronomical Society.

