

Image Details
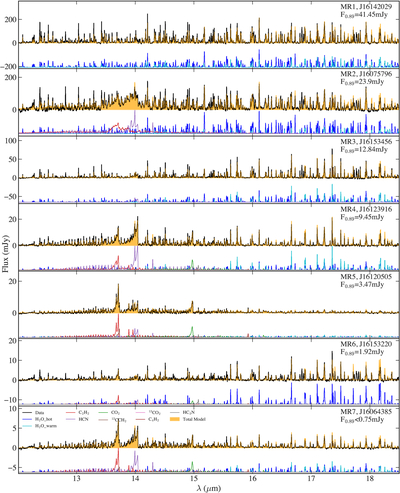
Caption: Figure 4.
Continuum-subtracted spectra and models for the MR disks in U2970, ordered from top to bottom by decreasing millimeter flux. The lower millimeter-flux disks show more C-rich spectra.
(The data used to create this figure are available in the online article.)
(The data used to create this figure are available.)
Other Images in This Article
Show More
Copyright and Terms & Conditions
© 2026. The Author(s). Published by the American Astronomical Society.

Copyright ©
2026 Astronomy Image Explorer. All Rights Reserved.
