

Image Details
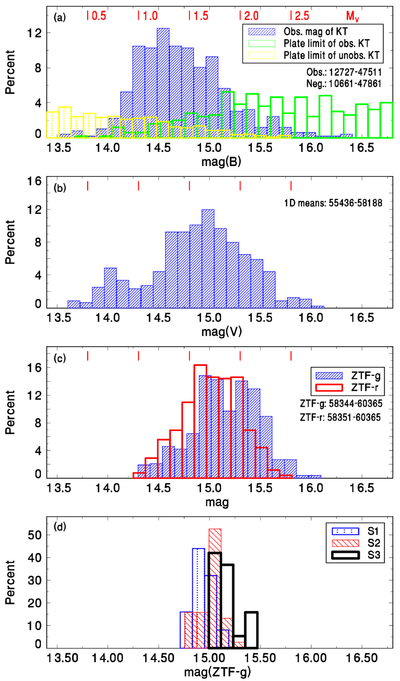
Caption: Figure 3.
(a) Histogram of the DASCH brightness (mag(B)) of KT Eri (prior to its 2009 CN eruption). The bar widths are 0.12 mag. “Obs. mag. of KT” refers to the detections of KT Eri, “Plate limit of obs. KT” shows the limit of the plate (extending to deeper values than this plot) on which KT Eri was detected. “Plate limit of unobs. KT” marks the limit of a plate on which KT Eri was below the detection limit. The vertical lines and numbers at the upper edge of the panel represent MV for d and AV of KT Eri (C. A. L. Bailer-Jones et al. 2021; B. E. Schaefer et al. 2022). (b) Histogram of the AAVSO V-band CCD data of KT Eri (starting in the very early phase of its postnova activity in Figure 1(a)). The bar widths are 0.12 mag. (c) Histograms of the brightness of KT Eri in the ZTF-g and ZTF-r bands from Figure 1(e), starting after the AAVSO V-band data in panel (b). The time segments of the data used for panels (a), (b), and (c) are given in JD–2,400,000. (d) Histograms of the brightness in the probable standstills abbreviated as S1, S2, and S3 in Figures 1(g)–(i). See Section 3 for details.
Other Images in This Article
Copyright and Terms & Conditions
© 2026. The Author(s). Published by the American Astronomical Society.

