

Image Details
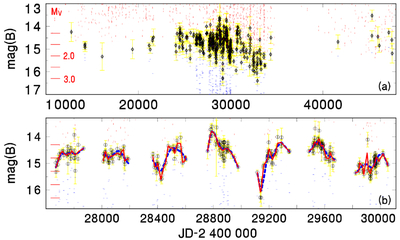
Caption: Figure 2.
(a) DASCH light curve of KT Eri from 1888 to 1989 (before the 2009 CN eruption). The error bars of the detections, plate limits of the detected KT Eri (horizontal lines), and upper limits of the undetected KT Eri (vertical lines) are plotted. The horizontal lines and numbers at the left edge represent MV for d and AV of KT Eri (C. A. L. Bailer-Jones et al. 2021; B. E. Schaefer et al. 2022). (b) A segment suitable for fitting with HEC13 to a complex light curve without isolated points. The smooth curves represent the HEC13 fits. The short-dashed curve is for ϵ = 1 (in dimensionless units) and ΔT = 40 days. The solid curve is for ϵ = 1 and ΔT = 15 days. See Section 3 for details.
Other Images in This Article
Copyright and Terms & Conditions
© 2026. The Author(s). Published by the American Astronomical Society.

