

Image Details
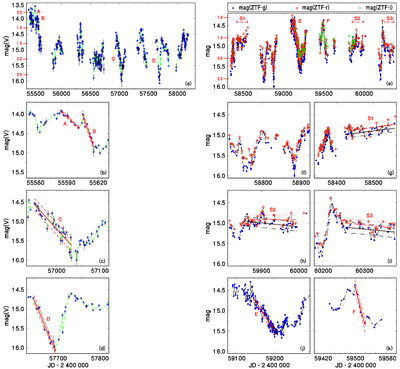
Caption: Figure 1.
(a) A segment of the initial postnova activity of KT Eri (after the 2009 CN eruption, 1 day means of the AAVSO CCD V-band data). The error bars of the 1 day means are plotted. The horizontal lines and numbers at the left edge represent absolute magnitudes, MV, for d and AV of KT Eri (C. A. L. Bailer-Jones et al. 2021; B. E. Schaefer et al. 2022). (b), (c), (d) The well-defined features of activity from panel a. The linear fits to the brightness of the well-covered decaying features A, B, C, and D are displayed along with their standard deviations. Notice their different slopes. (e) The postnova activity of KT Eri in the ZTF data. This light curve begins after the end of panel (a); their timescales are not identical. (f) A segment of drops to the faintest brightness. Notice that KT Eri became redder when its mag(ZTF-g) was fainter than ∼15.5. (g), (h), (i) Details of the surroundings of the segments S1, S2, and S3 (possible standstills) from the diagram (e). The linear fits to the brightness of each standstill (S1, S2, and S3) are displayed along with their standard deviations. A solid line is for the fit to mag(ZTF-g), and a dashed line is for the fit to mag(ZTF-r). (j), (k) The well-defined features of activity from panel (e). The linear fits to the brightness of the well-covered decaying features E and F are displayed along with their standard deviations. The points were connected by a line in the densely covered parts of the light curve to guide the eye. See Section 3 for details.
Other Images in This Article
Copyright and Terms & Conditions
© 2026. The Author(s). Published by the American Astronomical Society.

