

Image Details
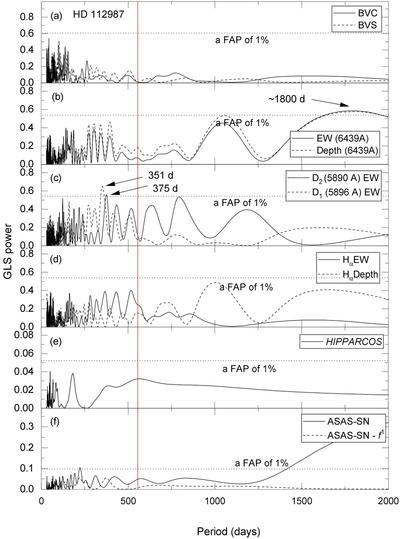
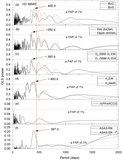
Caption: Figure 9.
GLS periodograms of various diagnostic indicators for HD 112987. Panels show the periodograms of (a) the mean BVS and BVC measurements derived from the Ti I 6064.626 Å and Fe I 6219.281 Å lines, (b) the EW and line depth of the line-profile diagnostic line, (c) the Na D2 and D1 EW indicators, (d) the H-line EW and depth indicators, (e) the HIPPARCOS photometric data, and (f) the ASAS-SN photometric data. The horizontal dashed line in each panel indicates the 1% FAP level and the vertical red solid line marks the RV period of 555 days.
Other Images in This Article
Copyright and Terms & Conditions
© 2026. The Author(s). Published by the American Astronomical Society.

Copyright ©
2026 Astronomy Image Explorer. All Rights Reserved.
