

Image Details
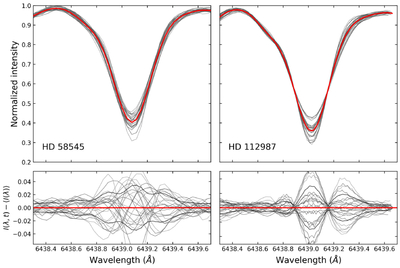
Caption: Figure 7.
Line-profile variations of the Ca I 6439.08 Å line for HD 58545 (left) and HD 112987 (right). The upper panels show the individual normalized spectra, with the mean line profile overplotted in red. The lower panels show the residual profiles relative to the mean profile, with the red horizontal line indicating zero residual. The residual profiles show epoch-to-epoch variations in line depth and profile shape in both stars.
Other Images in This Article
Copyright and Terms & Conditions
© 2026. The Author(s). Published by the American Astronomical Society.

Copyright ©
2026 Astronomy Image Explorer. All Rights Reserved.
