

Image Details
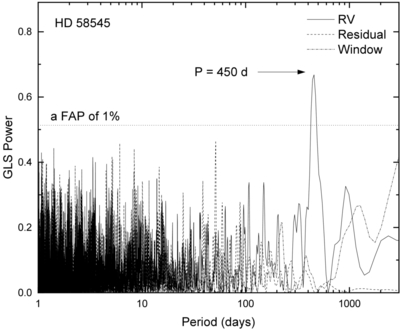
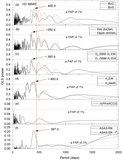
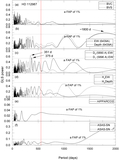
Caption: Figure 1.
The GLS periodogram of the RV data for HD 58545. The dominant peak corresponds to a period of 450 days. The dashed line represents the periodogram of the residual RVs after removal of the best-fit orbital solution. The horizontal dotted line marks the 1% false-alarm probability (FAP) threshold.
Other Images in This Article
Copyright and Terms & Conditions
© 2026. The Author(s). Published by the American Astronomical Society.

Copyright ©
2026 Astronomy Image Explorer. All Rights Reserved.
