

Image Details
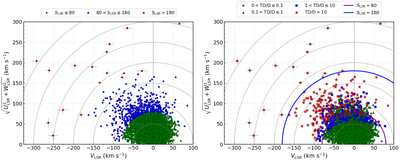
Caption: Figure 4.
Toomre diagrams for our WD sample. The two panels show the Galactic population classification based on Stot (P. E. Nissen 2004; left) and the kinematic criteria of T. Bensby et al. (2003, 2005; right). The gray curves represent iso-total-velocity contours, while the blue and purple curves denote the velocity boundaries adopted to distinguish the thick- and thin-disk populations, respectively.
Other Images in This Article
Copyright and Terms & Conditions
© 2026. The Author(s). Published by the American Astronomical Society.

Copyright ©
2026 Astronomy Image Explorer. All Rights Reserved.
