

Image Details
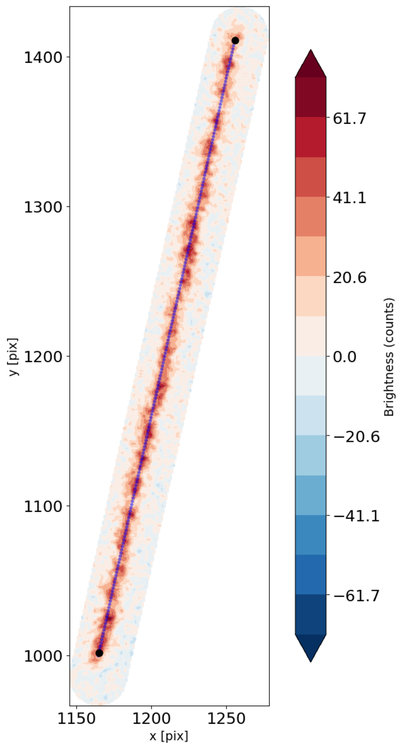
Caption: Figure 4.
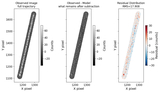
The figure shows the extracted trail of 2024 XA1. The brightness level of 0 corresponds to the mean background level in the image. The black points mark the fitted start and end positions, while the blue points trace the model-predicted trail, with a time interval of 0.1 s between adjacent points. From the image we note that the actual trail does not follow a perfectly straight line from the starting point to the ending point, but exhibits small deviations, which we attribute to atmospheric turbulence.
Other Images in This Article
Copyright and Terms & Conditions
© 2026. The Author(s). Published by the American Astronomical Society.

Copyright ©
2026 Astronomy Image Explorer. All Rights Reserved.
