

Image Details
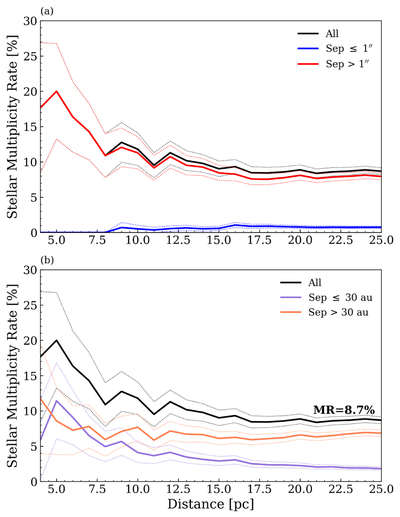
Caption: Figure 9.
Cumulative stellar multiplicity rates (MRs) as a function of distance (in 1 pc bins) for 291 wide multiples among the total of 3352 RMSTAR systems. Panel (a) shows the MR trends for different angular separations, with a solid black line for all systems, a solid blue line for systems with separations ≤ 1″, and a solid red line for systems with separations > 1″. Panel (b) shows the MR trends for different projected separations, with a solid black line for all systems, a solid purple line for systems with separations ≤ 30 au, and a solid orange line for systems with separations > 30 au. Dotted colored lines represent binomial errors matched to the heavier MR lines.
Other Images in This Article
Show More
Copyright and Terms & Conditions
© 2026. The Author(s). Published by the American Astronomical Society.

