

Image Details
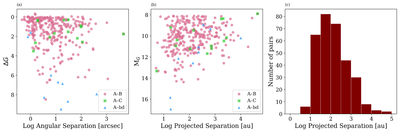
Caption: Figure 6.
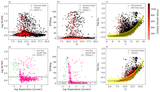
Three ways of evaluating the wide companion population of M dwarfs in RMSTAR are shown. Points indicate data for pairs using the absolute magnitudes and separations between the primary and each companion, with separations between A and B shown as pink circles, separations between A and C shown as green squares, and separations between A and a brown dwarf companion shown as blue triangles. (a) Δ G vs. log projected separation (arcseconds) is a purely observational schematic that illustrates the observational biases. For each system, Δ G is calculated between the primary star and each companion. (b) Primary star MG vs. log projected separation in astronomical units (au) places the systems into physical context. (c) Histogram of projected separations in log astronomical units reveals a peak in the distribution at ∼30 au. The decrease in the number of systems toward smaller separations is due to observational biases, whereas the decrease in the number of systems toward larger separations is astrophysical—few companions are found at large separations.
Other Images in This Article
Show More
Copyright and Terms & Conditions
© 2026. The Author(s). Published by the American Astronomical Society.

