

Image Details
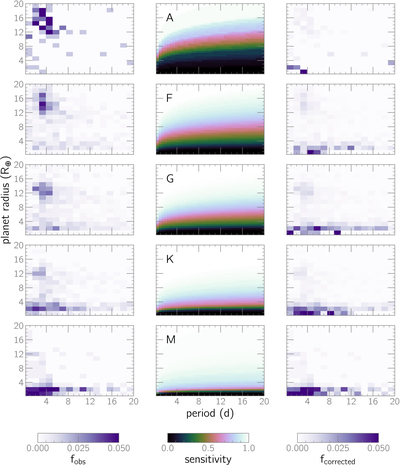
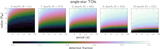
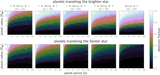
Caption: Figure 8.
Left column: 2D histograms showing the distribution of observed transiting exoplanets around single TOI hosts of a particular spectral type. fobs is the relative frequency of each bin within the parameter space. Middle column: sensitivity grid for that spectral type. The letter in the upper left corner indicates the spectral type for that row. Right column: 2D histograms corrected for TESS sensitivity. fcorrected is the relative frequency of each bin after correcting for the TESS sensitivity.
Other Images in This Article
Copyright and Terms & Conditions
© 2026. The Author(s). Published by the American Astronomical Society.

Copyright ©
2026 Astronomy Image Explorer. All Rights Reserved.
