

Image Details
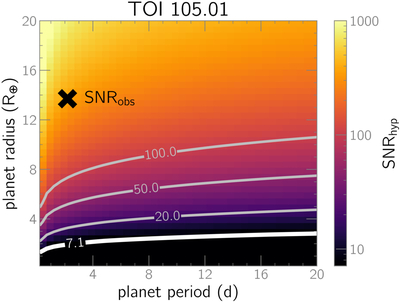
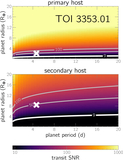
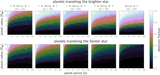
Caption: Figure 3.
Representative sensitivity grid. The true period and radius of the planet are marked with an “x” and result in SNR = 349, while the color map and contours indicate the scaled SNR of hypothetical planets of various periods and radii.
Other Images in This Article
Copyright and Terms & Conditions
© 2026. The Author(s). Published by the American Astronomical Society.

Copyright ©
2026 Astronomy Image Explorer. All Rights Reserved.
