

Image Details
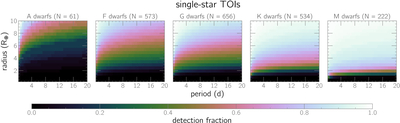
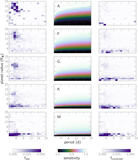
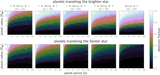
Caption: Figure 7.
Sensitivity grids by spectral type for single TOIs in our sample. These data are available in machine-readable-table format to facilitate their use in other studies. Although the grids are computed up to R = 20 R⊕, we display the grids only to a maximum of 10 R⊕ in order to highlight the parameter space of the most interest. The data behind this figure is available in 5 .csv files in the .tar.gz package. A python script is also available to reproduce the panels in the figure. The package also contains the data behind Figure 9.
(The data used to create this figure are available in the online article.)
(The data used to create this figure are available.)
Other Images in This Article
Copyright and Terms & Conditions
© 2026. The Author(s). Published by the American Astronomical Society.

