

Image Details
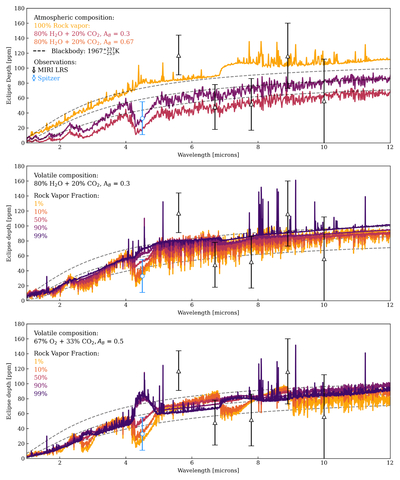
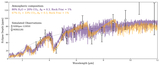
Caption: Figure 3.
Observed emission spectrum of TOI-431b from this work binned to five points in wavelength (5.05–6.15, 6.15–7.25, 7.25–8.35, 8.35–9.45, and 9.45–10.55 μm, respectively) plotted in black triangles. The eclipse depth measured with Spitzer in C. Monaghan et al. (2025) is shown as a blue circle. Solid, colored lines show GENESIS models (A. A. A. Piette et al. 2023) described in Section 3.3. The dotted black lines shows the blackbody temperature derived from the white light eclipse depth with a ±1σ range. Multiple different atmospheres can produce an eclipse depth consistent with our observations, and future observations will be necessary to distinguish them.
Other Images in This Article
Copyright and Terms & Conditions
© 2026. The Author(s). Published by the American Astronomical Society.

