

Image Details
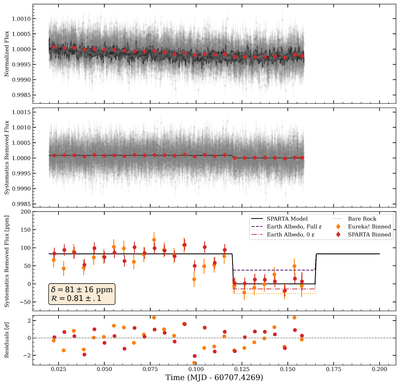
Caption: Figure 1.
The observed lightcurve for TOI-431b. First panel: the normalized flux SPARTA lightcurve with the binned points overlaid in red with respect to time. The determined eclipse and systematics model is overplotted in black. Second panel: the lightcurve with the systematics removed. Third panel: a zoom in on the binned points overlaying multiple light curves with varying eclipse depths, corresponding to different albedos and/or heat redistribution factors. These eclipse depths are derived from Equations 3 and 6 for the respective temperatures. Both the Eureka! and SPARTA! fits are plotted with the black model belonging to the SPARTA reduction. The models are extended beyond the end of our observation to show the full extent of the eclipse. Bottom panel: the residuals for the binned points with respect to each eclipse model in terms of σ.
Other Images in This Article
Copyright and Terms & Conditions
© 2026. The Author(s). Published by the American Astronomical Society.

