

Image Details
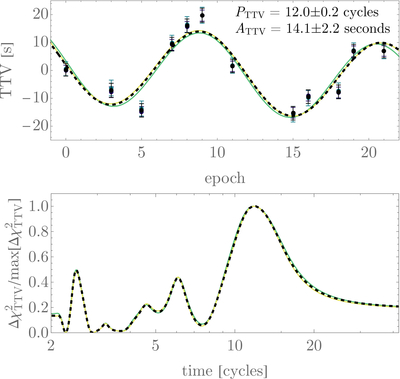
Caption: Figure 4.
The top panel shows the residuals of the measured 12 transit times of LP-890-9 c against a linear ephemeris i.e., the TTVs. Each epoch has four colored points, corresponding to the 2 × 2 reduction-likelihood pairs used in this work, plus a black averaged point. In practice, these are hardly distinguishable. The TTVs show overwhelming evidence for a periodic signal, with the Lomb–Scargle periodogram (bottom panel) finding maxima of Δχ2 > 300 in all cases. The best-fitting sinusoid parameters are provided inset, although the signal appears more complex than a sinusoid.
Other Images in This Article
Copyright and Terms & Conditions
© 2026. The Author(s). Published by the American Astronomical Society.

Copyright ©
2026 Astronomy Image Explorer. All Rights Reserved.
