

Image Details
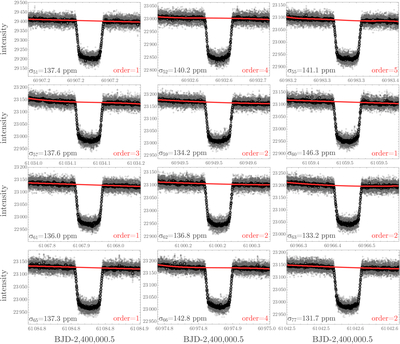
Caption: Figure 1.
The 12 transits of LP 890-9 c observed using NIRSpec PRISM and reduced using Eureka!. Each panel shows the unbinned reduced data using gray open circles, and the 30 second binned data with filled circles. The continuous red lines show an example polynomial trend model overlaid at the order denoted in the bottom-right corner of each panel (see Section 3.2 for a discussion of how the orders were selected). Note that our full astrophysics fits in fact vary the polynomial coefficients alongside the other parameters. The bottom-left numbers in each panel give the final rms precision of the binned data.
Other Images in This Article
Copyright and Terms & Conditions
© 2026. The Author(s). Published by the American Astronomical Society.

Copyright ©
2026 Astronomy Image Explorer. All Rights Reserved.
