

Image Details
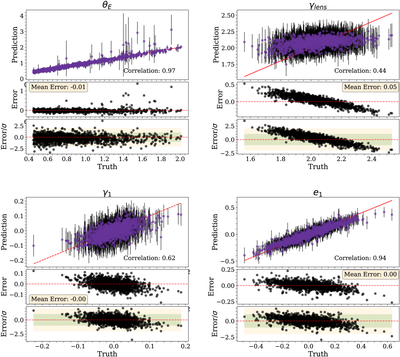
Caption: Figure 5.
Comparison of 1344 predicted Gaussian posteriors (obtained as described in Section 3.1) for fiducial data (refer to Section 2.2) against ground truth. Purple points correspond to the mean of the posteriors, and black lines correspond to the posterior 1σ width or standard deviation. In the lowest panel of each parameter subplot, the green shaded region represents the 1σ area and the yellow shaded region represents the 2σ region.
Other Images in This Article
Show More
Copyright and Terms & Conditions
© 2026. The Author(s). Published by the American Astronomical Society.

Copyright ©
2026 Astronomy Image Explorer. All Rights Reserved.
