

Image Details
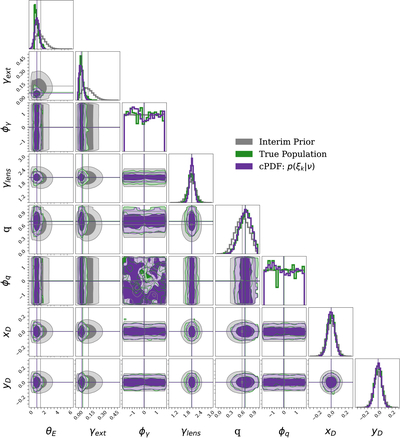
Caption: Figure 10.
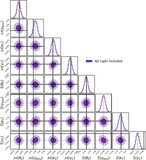
Here we show the recovered cpdf p(ξk∣ν), where we infer ν hierarchically. We start by showing the network 5 × 10⁵ combinations of lensing parameters sampled from the interim prior (gray contours) (Section 3.2.1). We apply the network to our realistic constructed sample of OM10 lenses (green contours) (Section 2.1) realized as LSST images (fiducial) (Section 2.2) and infer a multivariate Gaussian posterior pdf of the lensing parameters from each image (Section 3.1). Then, we combine these posteriors in a hierarchical inference to learn the parameters characterizing the parent distribution they are sampled from (purple contours). We model the parent distribution as a Gaussian with a diagonal covariance matrix and thus infer the M (mean) and Σ (scatter) at the population level (Section 3.3).
Other Images in This Article
Show More
Copyright and Terms & Conditions
© 2026. The Author(s). Published by the American Astronomical Society.

