

Image Details
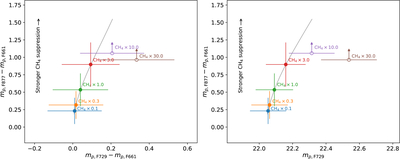
Caption: Figure 7.
Methane-sensitive photometric diagnostics for the controlled methane-abundance sweep. Left: planet F877–F661 color versus F729–F661 color. Right: planet F877–F661 color versus apparent F729 AB magnitude. Symmetric error bars indicate measurements derived from detected bands, while open symbols with arrows denote one-sided limits when F877 is below the adopted detection threshold. The gray curves show the theoretical loci as the methane scaling factor changes.
Other Images in This Article
Show More
Copyright and Terms & Conditions
© 2026. The Author(s). Published by the American Astronomical Society.

Copyright ©
2026 Astronomy Image Explorer. All Rights Reserved.
